How far, how fast, how soon: position x, velocity v and acceleration a, the language for describing how things move along a straight line.
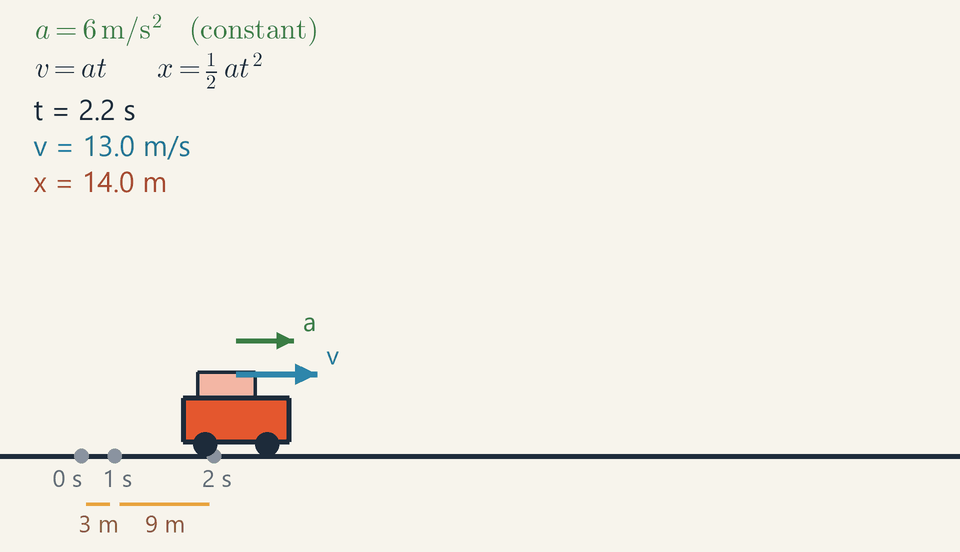
A car accelerating uniformly. Grey dots mark its position each second: the growing gaps show acceleration, and the blue velocity arrow grows steadily.
Beginner
Key ideas
Position tells you where something is; velocity tells you how fast it moves and in which direction.
Acceleration is how quickly velocity changes, measured in metres per second every second (m/s²).
Average speed = distance ÷ time: 100m÷20s=5m/s.
Slowing down is acceleration too: any change in velocity counts.
A car that speeds up covers more ground each second, so the gaps between its positions grow.
A car pulls away from standing still; a cyclist brakes. Kinematics is the part of physics that describes such motion without asking what causes it. To describe motion along a straight line, we need three ideas.
Position tells you where the object is, measured from a starting point, in metres. Velocity tells you how fast the position changes and in which direction, in metres per second. Speed is just how fast, with no direction; velocity is speed plus a direction. Acceleration tells you how fast the velocity changes, in metres per second per second (m/s²).
If a cyclist rides 100 metres in 20 seconds, the average speed is 100÷20=5m/s. If a car goes from standing still to 20 m/s in 4 seconds, it gains 5 m/s every second, so its acceleration is 5 m/s².
A common mix-up is to think that a fast object must be accelerating. A car cruising at a steady 30 m/s on a motorway has zero acceleration, because its velocity is not changing. A cyclist who brakes does have an acceleration: slowing down is also a change of velocity, and her acceleration points backward.
In the animation the car gains 6 m/s every second, and the grey dots mark where it is after each second. The gaps get bigger: that is what acceleration looks like.
Look at the gold gaps: 3 m, 9 m, 15 m, 21 m. They grow like the odd numbers 1, 3, 5, 7 (times 3 m). Galileo found this pattern in the early 1600s by timing balls rolling down a ramp, and it is the fingerprint of steady acceleration from rest.
Intermediate
Key ideas
Average velocity = displacement ÷ time; displacement (change of position) is not the distance travelled.
Choose the equation that leaves out the one quantity you neither know nor need.
On a v–t graph the slope is the acceleration and the area under the line is the displacement.
What we measure, and from where
Two people can give different numbers for where the same car is at the same moment, and both be right. To describe a motion we first need a reference frame: an origin, a positive direction along the line and a clock. The position x is then a signed number of metres: x=30m is 30 metres on the positive side of the origin, x=−5m is 5 metres on the other side. Another frame gives other numbers for the same motion.
The change of position is the displacement, Δx=x−x0, where x0 is the starting position. It has a sign and depends only on where the object started and where it ended. The distance travelled is the length of the whole path, and it is never negative. Walk 10 m forward and 10 m back: you have travelled 20 m, but your displacement is zero.
Velocity and acceleration are rates
Velocity measures how fast the position changes. Over a time interval Δt, the average velocity is vavg=ΔtΔx
Its sign gives the direction of motion. Speed is the size of the velocity, without the sign. Average speed is the distance travelled divided by the time; it equals the size of vavg only if the object never turns back. The velocity at one instant, the number on a speedometer, is the average velocity over a very short interval.
Acceleration measures how fast the velocity changes: a=Δv/Δt, in metres per second per second (m/s²). An acceleration of 6 m/s² adds 6 m/s to the velocity every second. When v and a have the same sign, the object speeds up; when their signs are opposite, it slows down. When a=0 the motion is uniform: x=x0+vt, equal distances in equal times.
The constant-acceleration equations
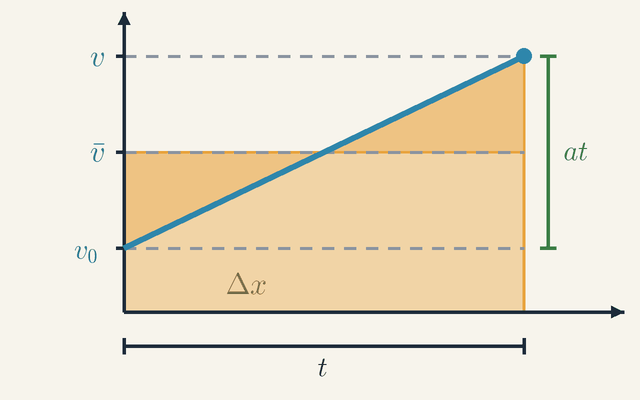
If a is constant, the velocity changes by the same amount every second, so its average over any interval lies exactly halfway between the starting and final values, 21(v0+v). Multiplying that average by the time gives the displacement. These two facts lead to four equations:
v=v0+at
x=x0+v0t+21at2
v2=v02+2aΔx
Δx=21(v0+v)t
Each equation links four of the five quantities Δx, v0, v, a and t, so any three known values give the other two. Choose the equation that leaves out the quantity you neither know nor need: if time plays no part, use the third; if the acceleration is unknown, use the fourth.
Worked example: the car in the animation
The car starts from rest at the origin, so v0=0 and x0=0, and it accelerates at a=6m/s2. After t=4s: v=v0+at=0+6⋅4=24m/s x=21at2=21⋅6⋅42=48m
These are the final values on the v and x readouts. The third equation checks them without using the time: v2=2⋅6⋅48=576m2/s2, so v=24m/s. At 1, 2 and 3 s the car is at 3 m, 12 m and 27 m, so the gaps between the grey dots are 3, 9, 15 and 21 m, each 6 m longer than the one before. The average velocity is 48/4=12m/s, half the final value, as the fourth equation predicts for a start from rest.
Meanwhile the blue v arrow grows by the same step every second while the green a arrow keeps its length: constant acceleration means equal gains in velocity in equal times, not equal distances.
Worked example: stopping distance
A driver at 14 m/s (about 50 km/h) sees a ball roll onto the road. She needs about 1.0 s to react, then brakes at a steady 7 m/s². How far does the car travel before it stops?
During the reaction time the car covers 14⋅1.0=14m at constant speed. While braking, v0=14m/s, v=0 and a=−7m/s2, negative because it points against the motion. The time is not asked for, so use the third equation: Δx=2av2−v02=2⋅(−7)0−142=14m
The car stops 28 m after the ball appears. At 28 m/s (about 100 km/h) the reaction distance doubles to 28 m, but the braking distance becomes 282/(2⋅7)=56m, four times as much: 84 m in all. Braking distance grows with the square of the speed, which is why speed limits near schools are so low.
Reading position–time and velocity–time graphs
On a position–time graph the slope is the velocity: a straight line means uniform motion, a horizontal line means rest, a downward slope means motion in the negative direction, and a curve that keeps getting steeper means speeding up.
On a velocity–time graph the slope is the acceleration, and the area under the line is the displacement (area below the time axis counts as negative). For the car, v rises in a straight line from 0 to 24 m/s in 4 s: the slope is 24/4=6m/s2, and the triangle under the line has area 21⋅4⋅24=48m. When v0 is not zero the area is a trapezium, 21(v0+v)t, which is the fourth equation.
Common mistakes
Speed is not velocity: two cars doing 20 m/s in opposite directions have the same speed but velocities of +20 and −20m/s.
Zero velocity is not zero acceleration. A ball thrown straight up at 15 m/s stops after 15/9.81≈1.5s, about 11.5 m up, then falls back; at the top its acceleration is still −g.
Negative acceleration does not always mean slowing down: a car speeding up in the negative direction has v<0 and a<0. Compare the signs of v and a.
The four equations need a constant a: split a motion that changes, such as cruising and then braking, into stages.
Convert km/h to m/s first (divide by 3.6), and keep the ½ and the square in 21at2: dropping them turns the car's 48 m into 96 m or 12 m.
Where you meet it
Stopping distances, a sprinter averaging 10 m/s over 100 m, lifts and trains that accelerate at about 1 m/s² to keep passengers comfortable: all of this is straight-line kinematics. It is also the vocabulary of the rest of mechanics. Free fall is this lesson with a=−g, projectile motion is two straight-line motions at once, and Newton's second law supplies the acceleration that these equations turn into a path.
Advanced
Key ideas
v=dx/dt and a=dv/dt; integrating a constant a twice gives the constant-acceleration equations.
For variable a, integrate: a(v) by separating variables, a(x) via a=vdv/dx.
Zero velocity does not mean zero acceleration: at the top of a vertical throw a=−g.
A Galilean change of frame shifts all velocities by a constant and leaves accelerations unchanged.
From average to instantaneous
The laws of motion speak about instants, yet any measured velocity covers an interval of time. How, then, can a velocity belong to a single instant? Take the average over a short interval, then see what it settles to as the interval shrinks.
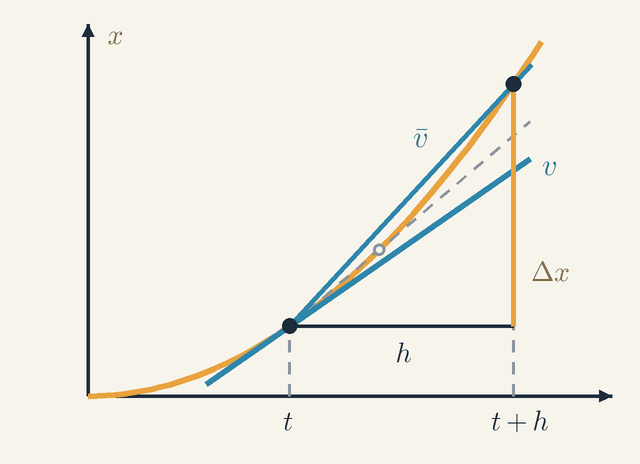
Figure 1. Position x against time. The chord from t to t+h has slope vˉ, the average velocity; as h shrinks (the dashed chord) it turns into the tangent, whose slope v is the velocity at the instant t.Legend
x
Position of the car along its path; the curve is x(t).
m
t
The instant at which the velocity is wanted.
s
t+h
A slightly later instant, a time h after t.
s
h
Length of the time interval from t to t+h.
s
Δx
Change of position from t to t+h: the rise of the chord.
m
vˉ
Average velocity over the interval: the slope of the chord, Δx/h.
m/s
v
Velocity at the instant t: the slope of the tangent, which the chords approach as h→0.
m/s
Figure 1 plots the position of the car in the animation, x(t)=3t2, with x in metres and t in seconds. Pick an instant t and a slightly later instant t+h, where h is a short time. The straight line joining the two points of the curve is called a chord. Along it the position rises by Δx while the time advances by h, so its slope Δx/h is the average velocity vˉ over the interval. Expanding (t+h)2=t2+2th+h2 gives vˉ=hΔx=h3(t+h)2−3t2=h6th+3h2=6t+3h
Now look at the dashed chord: its far end has slid down the curve towards the point at t. As h shrinks, the chord turns and settles on the line labelled v, the tangent that just touches the curve at t. In the formula the term 3h goes to zero, so the slope of the chord tends to 6t, the slope of the tangent. At t=2s the car is therefore doing exactly 12 m/s, even though every finite interval that starts at that instant gives a little more, 12+3h.
This limit of the ratio is the derivative of x with respect to t, and it defines the instantaneous velocity. The same step applied to the velocity defines the acceleration: v=limΔt→0ΔtΔx=dtdx,a=dtdv=dt2d2x
Two consequences follow. First, no single snapshot can show a velocity, because a velocity compares positions at neighbouring instants. That answers Zeno's arrow paradox, in which the arrow seems motionless at every instant of its flight: at each instant it has a position, and its velocity lies in how that position changes nearby. Second, position, velocity and acceleration form a chain of derivatives, x→v→a. Newton's dot notation writes the two steps compactly as x˙ and x¨.
Integrating back: constant acceleration
Going down the chain takes derivatives; going back up takes integrals. Knowing the acceleration, one integration gives the velocity and a second gives the position. The commonest case is a constant acceleration a, and every step of it can be read off a graph.
Figure 2. Velocity against time for a constant acceleration: the area under the line is the displacement Δx. The two darker triangles are equal, so Δx is also the area of the rectangle of height vˉ and width t.Legend
v0
Velocity at the start.
m/s
v
Velocity after the time t: v=v0+at.
m/s
vˉ
Mean velocity 21(v0+v): the dashed level half-way between v0 and v.
m/s
at
Velocity gained during t: the constant acceleration a times the time.
m/s
t
Time elapsed since the start.
s
Δx
Displacement during t: the shaded area under the line.
m
Figure 2 plots velocity against time. The velocity starts at v0. Because the acceleration is constant, the velocity grows by the same amount every second, so the graph is a straight line of slope a. After a time t it has risen by at (the bracket on the right), to v=v0+at. As an integral, with the integration variable written t′ to keep it apart from the upper limit t: v(t)=v0+∫0tadt′=v0+at
Over a very short time the velocity is nearly constant, so the displacement is velocity times that time: a thin strip of area under the graph. Adding the strips, the displacement Δx=x−x0 over the whole time t is the shaded area under the line. Split it into a rectangle of height v0 and width t, of area v0t, and a triangle of base t and height at, of area 21at2: x(t)=x0+∫0tv(t′)dt′=x0+v0t+21at2
The same area can also be counted in one piece. The dashed level vˉ lies half-way between v0 and v. Because the line is straight, it crosses that level exactly at the middle of the interval, at t/2. On the left half the line runs below the level, leaving a triangular gap; on the right half it runs above, adding a triangle. These are the two darker triangles, and they are equal, each with base t/2 and height at/2. Cut off the triangle on the right, drop it into the gap on the left, and the area under the line becomes a rectangle of height vˉ and width t: Δx=vˉt=21(v0+v)t
Each integration brought in a constant: v0 the first time, x0 the second. They are not decoration. The acceleration fixes the shape of the motion; the starting position and velocity pick out which motion of that shape actually happens. That is why Newton's second law, which supplies the acceleration, always needs exactly two pieces of starting information.
A further relation leaves out the time, which helps when the time is neither given nor asked for. It comes from the chain rule: since dx/dt=v, a=dtdv=dxdvdtdx=vdxdv,soadx=vdv With a constant, integrate the left side from x0 to x and the right side from v0 to v. This gives a(x−x0)=21(v2−v02), that is v2=v02+2aΔx
Multiply both sides of a(x−x0)=21(v2−v02) by the mass m and it reads maΔx=21mv2−21mv02. Since ma is the force, this says that force times displacement equals the change of kinetic energy: the work–energy theorem, already hidden in kinematics.
Of the four constant-acceleration equations, Δx=21(v0+v)t is the oldest. Scholars at Merton College, Oxford, stated it around 1335 as the mean speed theorem, and Nicole Oresme soon proved it by comparing areas, much as Figure 2 does, some two and a half centuries before Galileo tested it with balls rolling down a ramp.
Galileo's odd-number rule follows from it too. Starting from rest, the distance covered during the n-th second is x(n)−x(n−1)=21a[n2−(n−1)2]=21a(2n−1), so the distances in successive seconds grow as 1, 3, 5, 7. For the car, with a=6m/s2, they are 3, 9, 15 and 21 m.
Slopes and areas
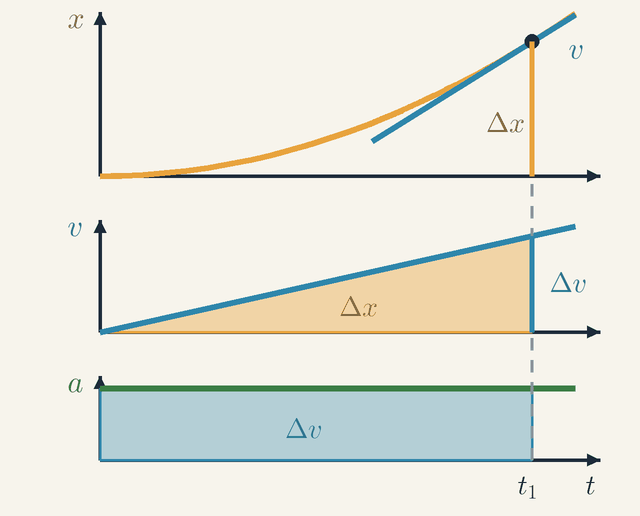
Graphs of position, velocity and acceleration are the quickest way to read a motion, and every rule for reading them is a statement about derivatives (slopes) or integrals (areas). Figure 3 shows all the rules on one example.
Figure 3. Position, velocity and acceleration of the car on one time axis. Slopes go down the stack (at t1 the tangent to x(t) has slope v); areas go up it (the area under v is the rise Δx, the area under a the rise Δv).Legend
x
Position; its graph (top) is a parabola.
m
v
Velocity: the straight line of the middle graph, and the slope of the tangent to x(t) at t1.
m/s
a
Acceleration: constant here, so its graph (bottom) is a horizontal line.
m/s2
t
Time, the horizontal axis shared by all three graphs.
s
t1
The instant at which the tangent is drawn and the areas end.
s
Δx
Change of position from 0 to t1: the rise of x(t), equal to the area under v(t).
m
Δv
Change of velocity from 0 to t1: the rise of v(t), equal to the area under a(t).
m/s
Figure 3 stacks the three graphs of the car in the animation on one time axis: x(t)=3t2 at the top, v(t)=6t in the middle and the constant a=6m/s2 at the bottom. Read it first from top to bottom, by slopes. At the instant t1=4s the tangent to the parabola x(t) has a slope equal to the velocity there, v=6⋅4=24m/s: it climbs 24 m for every second. The middle graph v(t) is a straight line because its slope, the acceleration, is the same at every instant.
The bending of x(t) shows the sign of the acceleration, because a is the rate at which the slope v changes. A graph that curves upward has a growing slope, so a>0; one that curves downward has a<0; a straight stretch has a=0.
Now read from bottom to top, by areas. The area under v(t) from 0 to t1 is a triangle, 21⋅4s⋅24m/s=48m, and it equals the rise Δx of x(t) over the same time: indeed x(4)=3⋅16=48m. The area under a(t) is a rectangle, 6m/s2⋅4s=24m/s, and it equals the rise Δv of v(t). In the figure each area carries the same label as the rise it produces.
Two cautions. First, area under v(t) counts as negative where v<0, so it gives the displacement, not the distance travelled; the distance is ∫∣v∣dt. Second, the graphs of v and a say nothing about where the motion started: shifting x(t) up or down leaves both unchanged, so x0 must always be given separately.
When the acceleration is not constant
Real accelerations change: an engine's push fades, air resists more at higher speed, a spring pulls harder the further it is stretched. The method depends on what the acceleration is a function of, and three cases cover most problems.
Acceleration given as a function of time, a(t): integrate twice, first v=v0+∫0tadt′, then x=x0+∫0tvdt′. The worked problem below is of this kind.
Acceleration that depends on velocity, a(v), as with drag: since a=dv/dt, separate the variables as dt=dv/a(v) and integrate. For the linear drag a=−kv, with k a constant, this gives v=v0e−kt and x=x0+(v0/k)(1−e−kt). The body never quite stops, yet it covers only a finite distance, v0/k. If the car of the animation, at 24 m/s, were slowed by such a drag alone with k=0.5s−1, it would coast at most 24/0.5=48m. For a body falling against quadratic drag, a=g−bv2 with downward taken as positive, the acceleration dies away as v approaches the terminal speed g/b, at which a=0.
Acceleration that depends on position, a(x), as with springs: integrate adx=vdv from above. For a=−ω2x it gives v2=v02−ω2(x2−x02). Multiplied by 21m, this is energy conservation for an oscillator, found before energy has even been introduced.
Stepping forward numerically
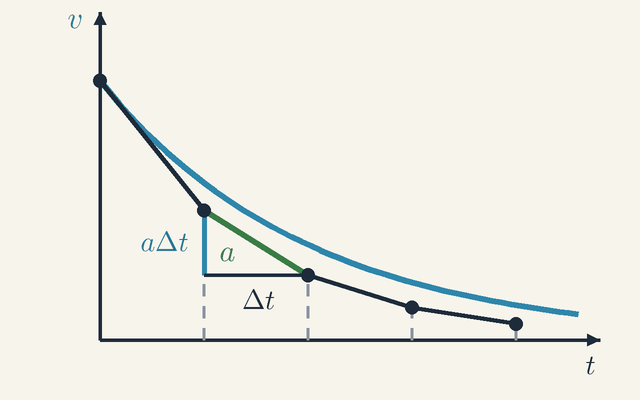
Most accelerations met in practice lead to equations that no formula solves. The motion is then built up in small time steps, each using the acceleration known at its start. Figure 4 shows the simplest such scheme, Euler's method, on a case whose exact answer is known, so that its error can be seen.
Figure 4. Drag, a=−kv, followed in numerical steps of length Δt. Each step keeps the slope a found at its start, so the steps lie below the exact curve; they approach it as Δt shrinks.Legend
v
Velocity of the coasting car; the blue curve is the exact v(t), the broken line the numerical steps.
m/s
t
Time.
s
Δt
Length of one time step.
s
a
Acceleration a=−kv found at the start of a step and kept for the whole step: the slope of the step (negative, since v falls).
m/s2
aΔt
Change of velocity in one step: negative here, a decrease.
m/s
Figure 4 follows the coasting car with drag, a=−kv, with the numbers of the example above: k=0.5s−1 and v0=24m/s. The blue curve is the exact solution v(t)=v0e−kt. The black broken line is the numerical estimate, with a deliberately coarse step Δt=1s so that the error is easy to see.
Every step follows the same rule. At the start of the step, work out the acceleration from the current velocity, a=−kv. Assume it keeps that value for the whole step, so the velocity changes by aΔt: replace v by v+aΔt. Advance the position the same way, replacing x by x+vΔt, and repeat from the new values. The highlighted step shows one pass: its slope is the a found at its start, so across the time Δt the velocity drops by aΔt and no more.
Here each step multiplies the velocity by 1−kΔt=0.5. After 1, 2, 3 and 4 s the steps give 12, 6, 3 and 1.5 m/s, against exact values of 14.6, 8.8, 5.4 and 3.2 m/s. The steps fall below the curve because the true deceleration weakens as v falls during a step, while the numerical step keeps the stronger value it started with. The error is proportional to Δt: once the step is small, halving it roughly halves the error, so the steps converge to the exact motion as Δt→0. Orbits, weather forecasts and the physics of video games are computed with refined versions of this idea.
Worked problem: a fading push
Here is an acceleration that changes in time, handled by integrating twice. Suppose the car's push fades steadily, a(t)=a0(1−t/τ), with a0=6m/s2 and τ=8s, starting from rest at x=0. The acceleration falls in a straight line from a0 to zero at t=τ. How fast is the car going, and how far has it gone, when the push dies out?
Integrate once, with v0=0: v(t)=∫0ta0(1−τt′)dt′=a0(t−2τt2) so v(τ)=a0(τ−τ/2)=a0τ/2=24m/s, the same final speed as in the animation. Integrate again, with x0=0: x(t)=a0(2t2−6τt3),x(τ)=3a0τ2=36⋅64=128m
Compare the car in the animation, which reached 24 m/s after 4 s and 48 m: this one needs 8 s and 128 m. Its v(t) is now a parabola that flattens out at t=τ, where a=0, and the area under it is two thirds of the 8 s by 24 m/s rectangle, 32⋅192=128m.
A tempting shortcut fails. The average acceleration is 24/8=3m/s2, but treating it as constant gives 21⋅3⋅82=96m, which is 32 m short. This car gains most of its speed early, so it spends longer going fast: its average speed is 128/8=16m/s, not the 12 m/s of a steady build-up. The constant-acceleration formulas cannot be rescued by putting in an average acceleration.
Limits of validity
Everything above rests on three idealisations, and each one fails somewhere. First, the body is treated as a point with a single position. For a car or a planet that means following its centre of mass; spin and deformation need their own description.
Second, x(t) is assumed smooth enough to be differentiated twice. A collision that seems to reverse a velocity at once is really a very large acceleration over a very short time. At the scale of atoms the idea of a sharp path x(t) fails altogether, because quantum mechanics does not allow a particle a precise position and a precise velocity at the same time.
Third, Galilean kinematics assumes that all observers share one clock. Velocities then simply add: in a frame moving at constant velocity u, a body's velocity is v′=v−u, while its acceleration is the same in every such frame. That is why Newton's laws hold in every inertial frame.
Special relativity shows that the shared clock is an approximation, valid for speeds far below the speed of light, c≈3.00×10⁸m/s. For the car at 24 m/s the corrections are of order v2/c2≈6×10−15, far below anything measurable. GPS satellites, at about 3.9 km/s, are another matter: this effect alone makes their clocks lose some 7 microseconds a day, and without a correction their position fixes would drift by kilometres within a day. Gravity, through general relativity, adds a larger effect in the opposite direction.
Where this leads
Kinematics describes motion; dynamics explains it. Newton's second law supplies the acceleration, a=F/m, and kinematics turns that acceleration into a trajectory: that is the whole programme of classical mechanics. The cases met here return throughout. Free fall is a constant acceleration of size g, pointing down. Projectile motion is two independent straight-line motions, one uniform and one uniformly accelerated. In circular motion the speed can stay constant while the velocity turns, which takes an acceleration v2/r towards the centre. Simple harmonic motion is a=−ω2x, drag supplies an a(v), and v2=v02+2aΔx returns as the work–energy theorem. Relative velocities and moving frames come next, in Vectors and Relative Motion.
Key formulas
Average velocity
vavg=ΔtΔx
Divide the displacement by the time it took. The result is the steady velocity that would produce the same displacement in the same time; it says nothing about how the motion went in between. Because Δx has a sign, so does vavg, and a round trip has an average velocity of zero.
Symbols
vavg
average velocity over the interval
m/s
Δx
displacement during the interval
m
Δt
duration of the interval
s
When it holds: Holds for any motion. It is not the average speed (distance divided by time) when the object turns back; letting Δt→0 gives the instantaneous velocity dx/dt.
Example: The car in the animation covers 48 m in 4 s: vavg=48/4=12m/s, half its final speed.
Acceleration
a=ΔtΔv
Acceleration is the change of velocity divided by the time it took, so its unit is metres per second per second, m/s². Its sign is the sign of the change Δv, not of the velocity itself: a car braking while it moves in the positive direction has a<0.
Symbols
a
average acceleration over the interval
m/s2
Δv
change of velocity, final minus initial
m/s
Δt
duration of the interval
s
When it holds: Gives the average acceleration over Δt. It equals the acceleration at every instant only if the acceleration is constant; in general a=dv/dt.
Example: From rest to 24 m/s in 4 s: a=24/4=6m/s2.
Velocity at constant acceleration
v=v0+at
With a constant acceleration the velocity changes by a every second, so after a time t it has changed by at. On a velocity–time graph this is a straight line that starts at v0 and has slope a.
Symbols
v
velocity at time t
m/s
v0
initial velocity, at t=0
m/s
a
acceleration (constant)
m/s2
t
time since the start
s
When it holds: Only while the acceleration stays constant; for a changing acceleration, integrate it over time instead.
Example: Braking from 14 m/s at a=−7m/s2: v=14−7t reaches zero after 2 s.
Position at constant acceleration
x=x0+v0t+21at2
The displacement is the area under the velocity–time line: a rectangle v0t for the starting velocity plus a triangle 21at2 for the velocity gained. Added to the starting position, it gives where the object is at time t. The t2 is why the distances covered in successive seconds keep growing.
Symbols
x
position at time t
m
x0
initial position, at t=0
m
v0
initial velocity
m/s
a
acceleration (constant)
m/s2
t
time since the start
s
When it holds: Only while the acceleration stays constant, with t counted from the moment the object is at x0 with velocity v0.
Example: The car in the animation, from rest with a=6m/s2: after 4 s, x=21⋅6⋅42=48m.
Velocity and displacement without time
v2=v02+2aΔx
Eliminating t between the two previous equations links velocity and displacement directly, which is the natural choice when time is neither given nor asked for. Multiplied by m/2, it is the work–energy theorem: force times displacement equals the change of kinetic energy.
Symbols
v
final velocity
m/s
v0
initial velocity
m/s
a
acceleration (constant)
m/s2
Δx
displacement
m
When it holds: Only for a constant acceleration. It gives v2, so the sign of v must come from the situation: a ball thrown upward passes each height twice, once going up and once coming down.
Example: Braking at 7 m/s² from 28 m/s: Δx=282/(2⋅7)=56m.
Glossary
Kinematics
The description of motion (where a body is, how fast it moves, how its velocity changes) without asking what causes it. The causes are the subject of dynamics.
Reference frame
The viewpoint from which motion is measured: an origin, a positive direction and a clock. Positions and velocities depend on the frame; for frames moving steadily relative to each other, accelerations do not.
Point particle
A body treated as a single point with one position, ignoring its size and spin. A good model whenever the size does not matter for the question asked.
Displacement
The change of position, Δx=x−x0. It has a sign and depends only on the start and the end, not on the path in between.
Distance travelled
The total length of the path covered, never negative. Going 10 m forward and 10 m back is a distance of 20 m but a displacement of zero.
Speed
How fast something moves, whatever the direction: the size of the velocity. Average speed is distance travelled divided by time.
Velocity
How fast the position changes, with a sign that gives the direction. At an instant it is the derivative v=dx/dt; over an interval, the average Δx/Δt.
Acceleration
How fast the velocity changes, a=Δv/Δt, in m/s². Speeding up, slowing down and turning are all accelerations.
Deceleration
Slowing down, that is, an acceleration that points against the velocity. It is negative only if the body moves in the positive direction.
Uniform motion
Motion in a straight line at constant velocity, so a=0 and equal distances are covered in equal times: x=x0+vt.
Uniformly accelerated motion
Motion with a constant acceleration: the velocity changes by the same amount every second, and the four constant-acceleration equations apply.
Free fall
Motion under gravity alone, with air resistance neglected. Near the Earth's surface every body then has the same downward acceleration, g≈9.81m/s2.
Quantities
x
Position
m
Where the object is along the line, measured from the origin; negative on the other side of it.
x0
Initial position
m
The position at t=0, where the motion is taken to start.
Δx
Displacement
m
Final minus initial position, x−x0: how far the object ended up from where it started, and on which side.
t
Time
s
The reading of the reference frame's clock, usually counted from the start of the motion.
v
Velocity
m/s
The rate of change of position at an instant; its sign gives the direction of motion.
v0
Initial velocity
m/s
The velocity at t=0.
vavg
Average velocity
m/s
Displacement divided by the time taken, Δx/Δt: the constant velocity that would give the same displacement in the same time.
a
Acceleration
m/s2
The rate of change of velocity; a=6m/s2 means 6 m/s gained every second.
g
Free-fall acceleration
m/s2
The acceleration of a body falling freely near the Earth's surface, about 9.81m/s2, directed downward.
Quiz
Beginner A runner covers 400 m in 80 s. What is her average speed?
5 m/s
320 m/s
0.2 m/s
4.8 m/s
Show answer
Answer: A. 5 m/s
Average speed is distance divided by time: 400 ÷ 80 = 5 m/s.
Beginner What does acceleration measure?
How fast velocity changes
How far an object travels
How heavy an object is
How fast position changes
Show answer
Answer: A. How fast velocity changes
Acceleration is the rate of change of velocity, measured in m/s².
Intermediate You walk 30 m east, then 30 m west. What is your displacement?
0 m
60 m
30 m east
30 m west
Show answer
Answer: A. 0 m
Displacement is the change in position. You end where you started, so it is zero even though you walked 60 m.
Intermediate On a velocity–time graph, what does the area under the line represent?
Displacement
Acceleration
Speed
Force
Show answer
Answer: A. Displacement
Area = velocity × time, which is displacement. The slope would be acceleration.
Advanced A ball is thrown straight up. At the highest point, what is its acceleration?
9.81 m/s² downward
Zero
9.81 m/s² upward
It depends on the throw speed
Show answer
Answer: A. 9.81 m/s² downward
The velocity is momentarily zero, but gravity still acts, so the acceleration stays −g throughout the flight.
Advanced An object's acceleration is a = −k·v. How does its velocity evolve?
It decays exponentially
It decreases linearly
It stays constant
It oscillates
Show answer
Answer: A. It decays exponentially
dv/dt = −kv separates to dv/v = −k dt, giving v = v₀·e^(−kt).
Beginner A car cruises along a straight motorway at a steady 30 m/s. What is its acceleration?
30 m/s²
0 m/s²
9.81 m/s²
It cannot be known without the car's mass
Show answer
Answer: B. 0 m/s²
Acceleration is the change in velocity each second. The velocity stays 30 m/s, so the acceleration is zero, however fast the car goes.
Intermediate A car starts from rest with a constant acceleration of 6 m/s². How far has it travelled after 4 s?
24 m
96 m
48 m
12 m
Show answer
Answer: C. 48 m
x = ½·a·t² = ½·6·4² = 48 m. 24 is a·t, the speed in m/s, not a distance; 96 m forgets the ½; 12 m forgets to square the time.
 Physics Tutor